Reading a session
The session page is a dark surface with two columns: timing on the left, channels on the right, one cursor shared by everything. This page explains each part and, where the app makes a judgement call, what the judgement is.
Last verified against build f98a29e · 2026-09-06
The page
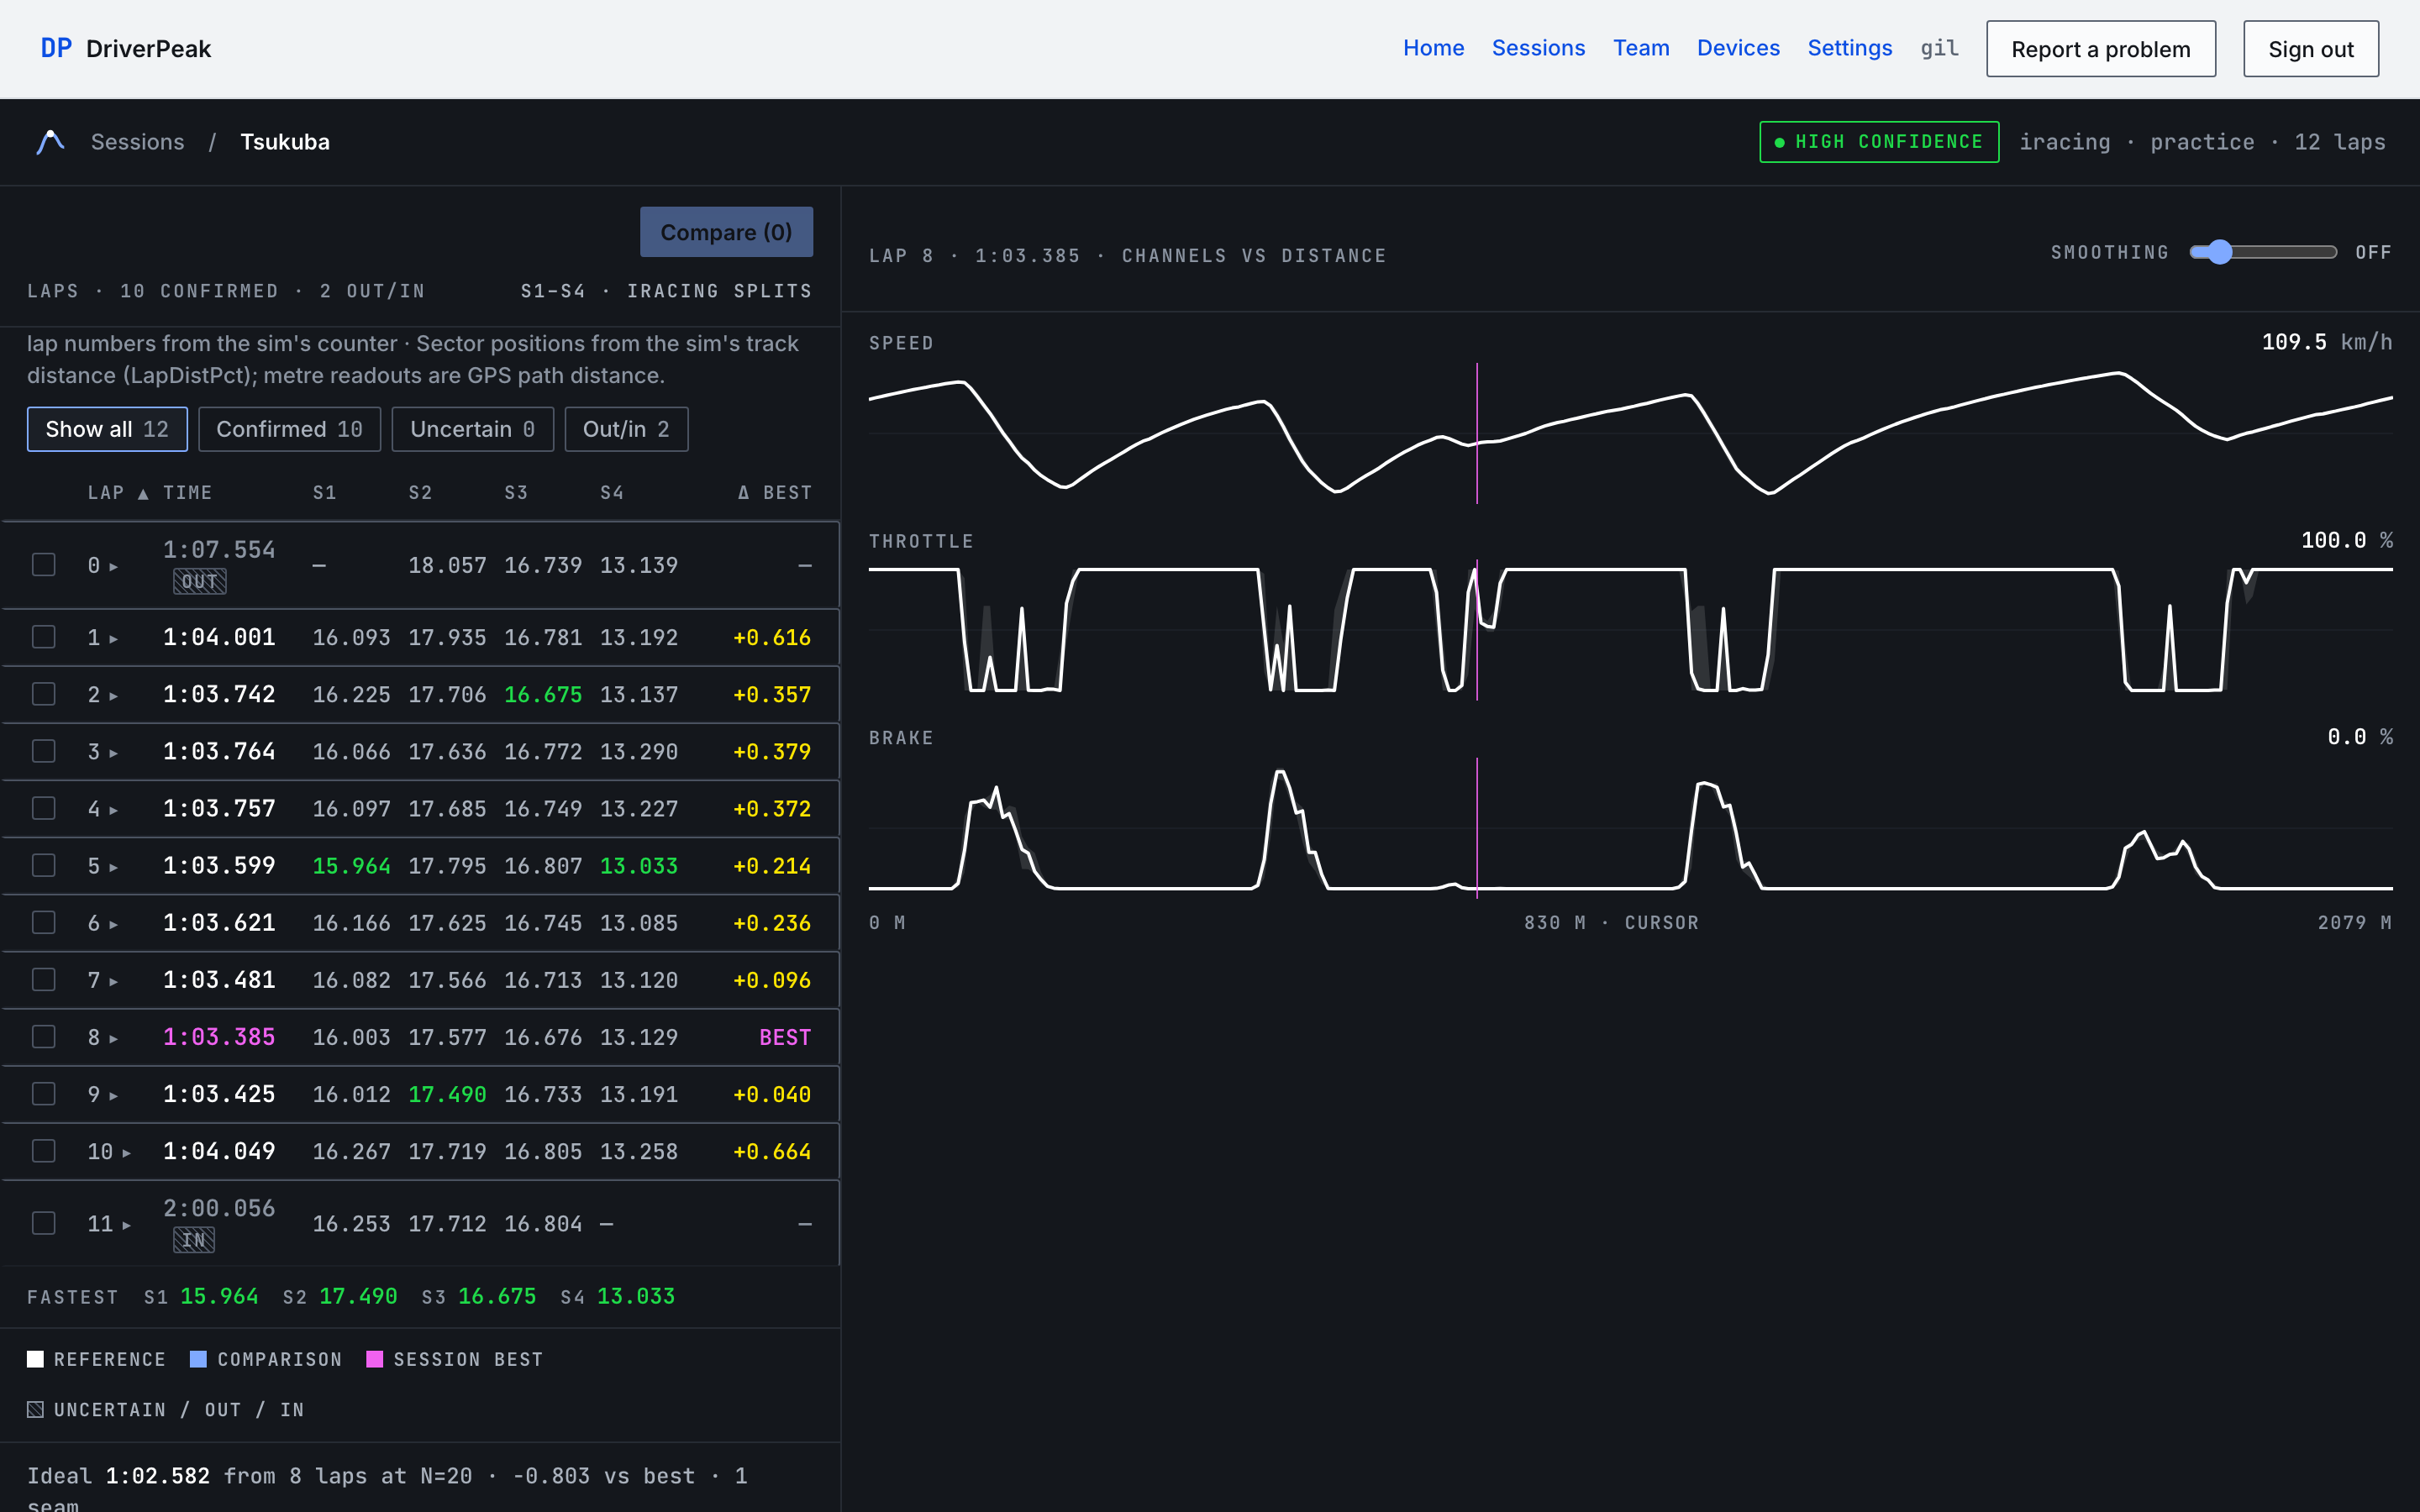
Open a session from Sessions. The bar at the top shows the track and date, the confidence chip (hover it for the detection notes) and the logger, session type and lap count. Below it: the lap table and the track map on the left, the channel charts and the channel rail on the right.
The lap table
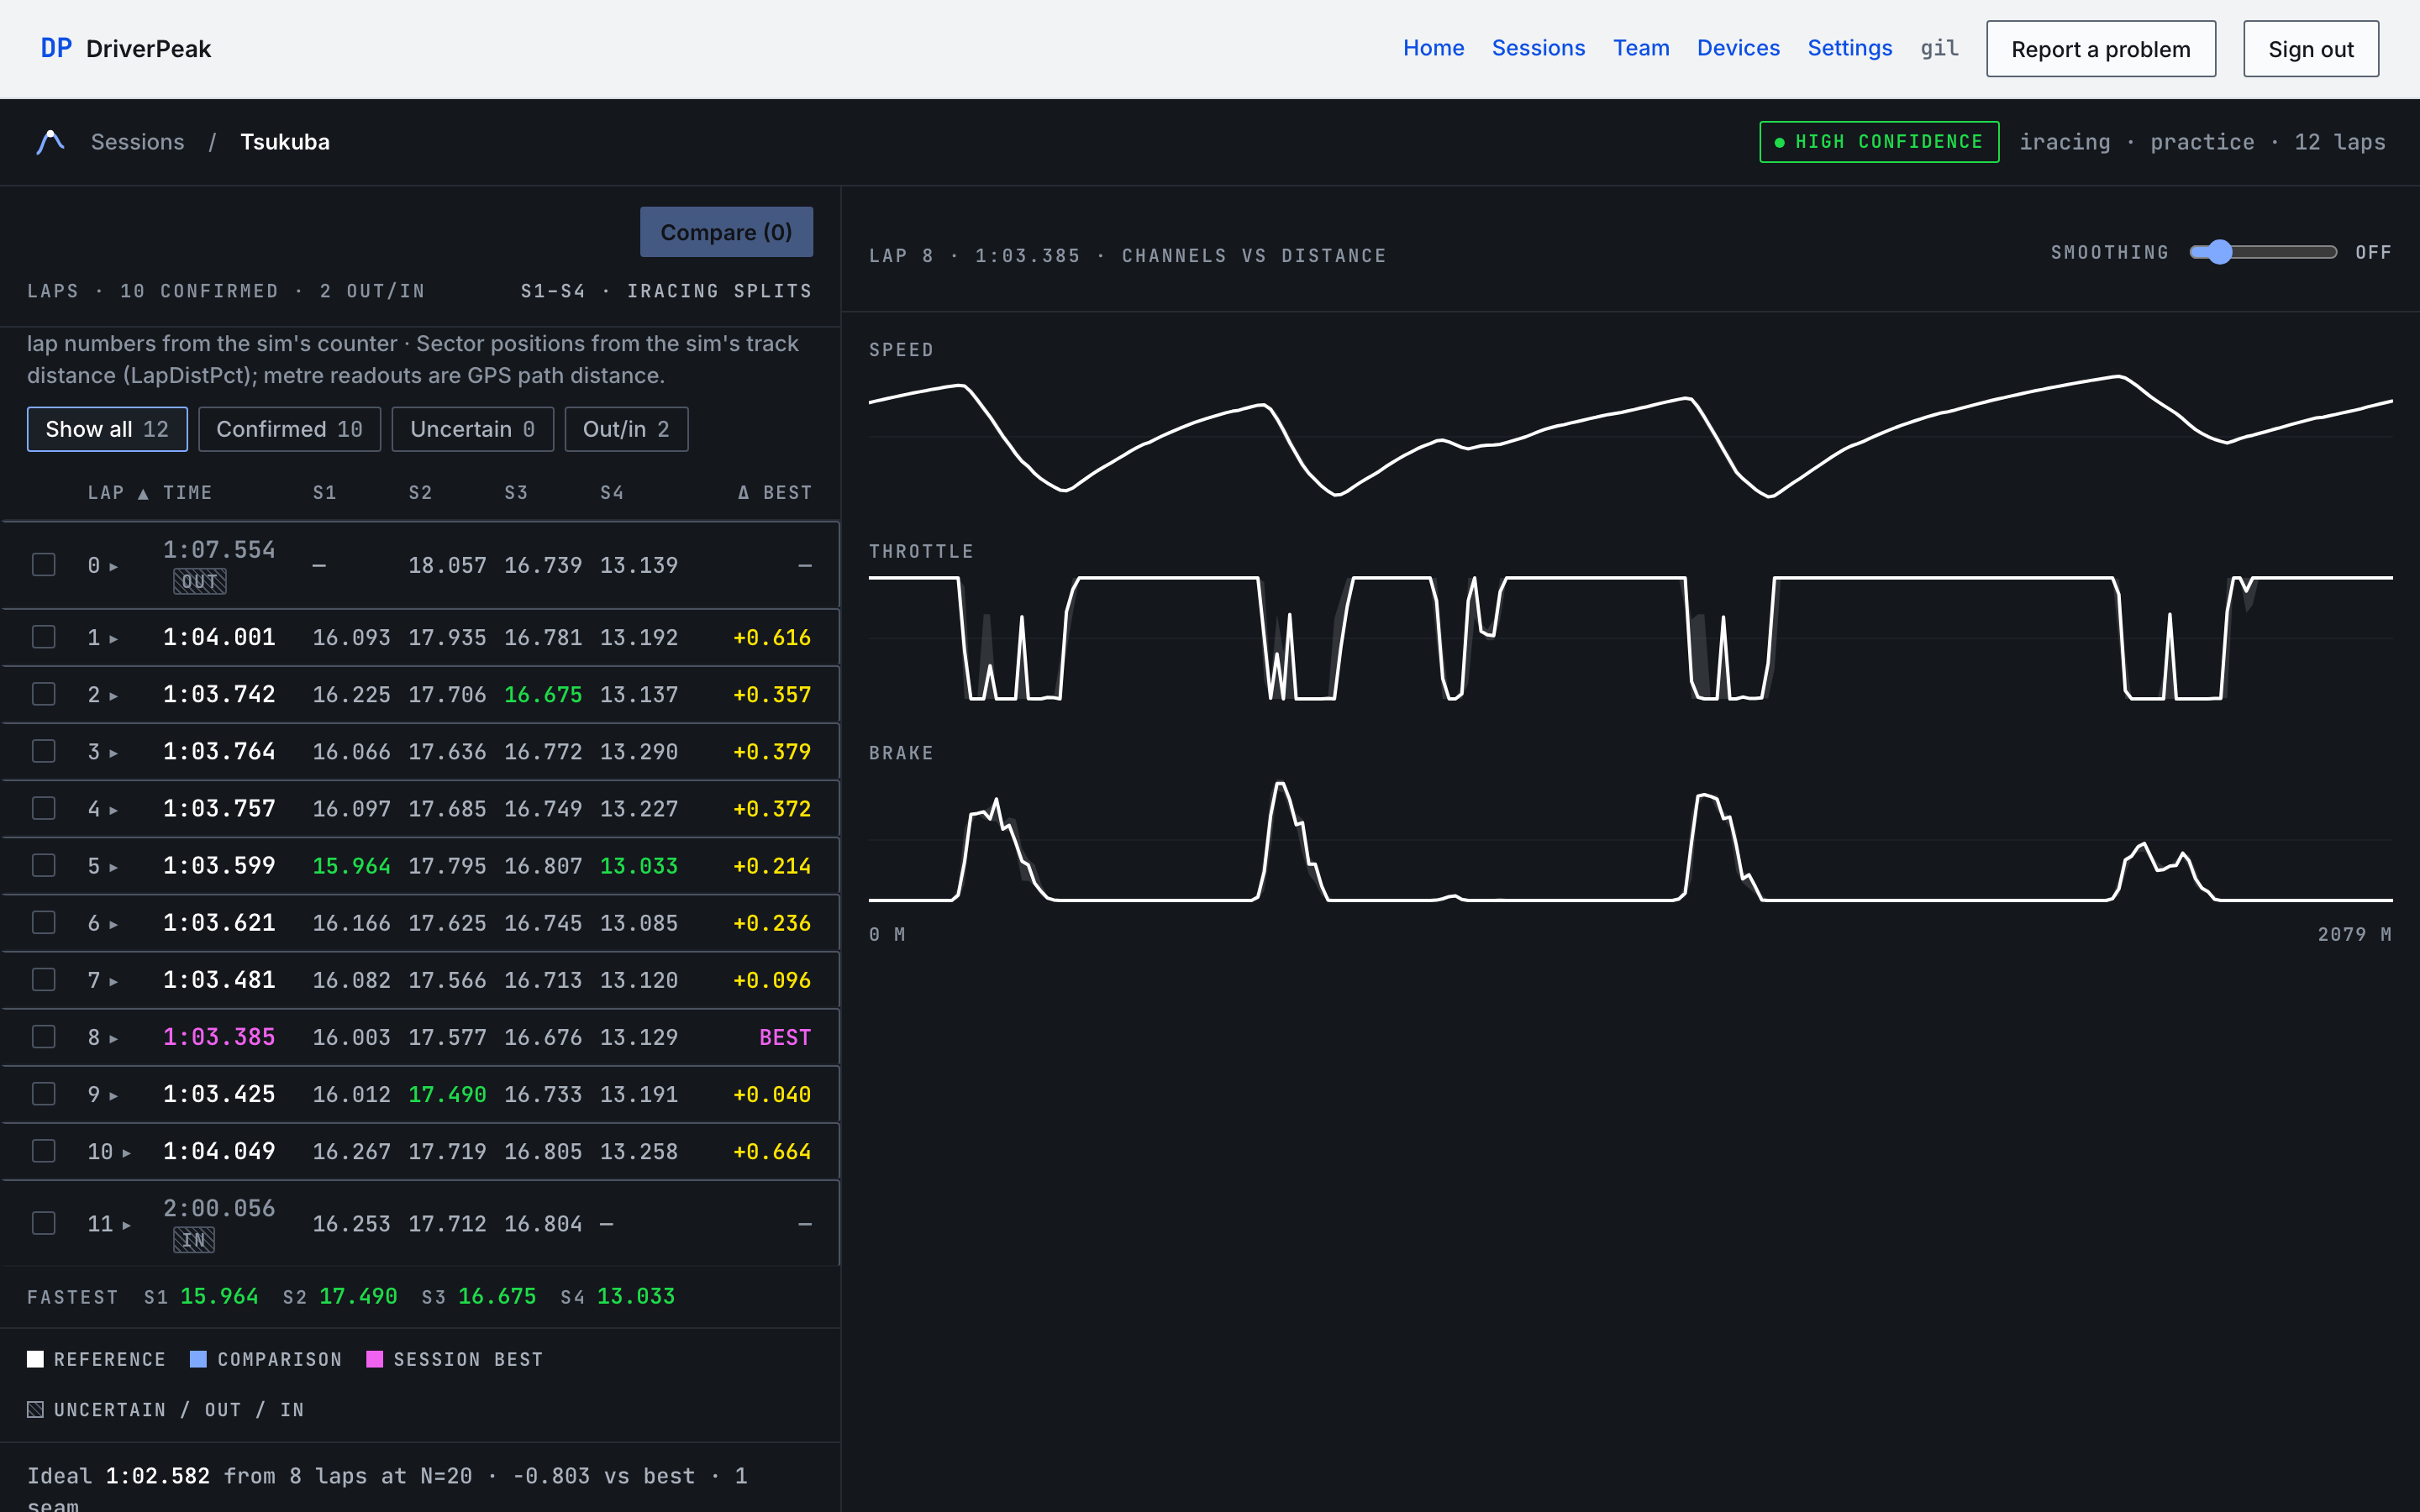
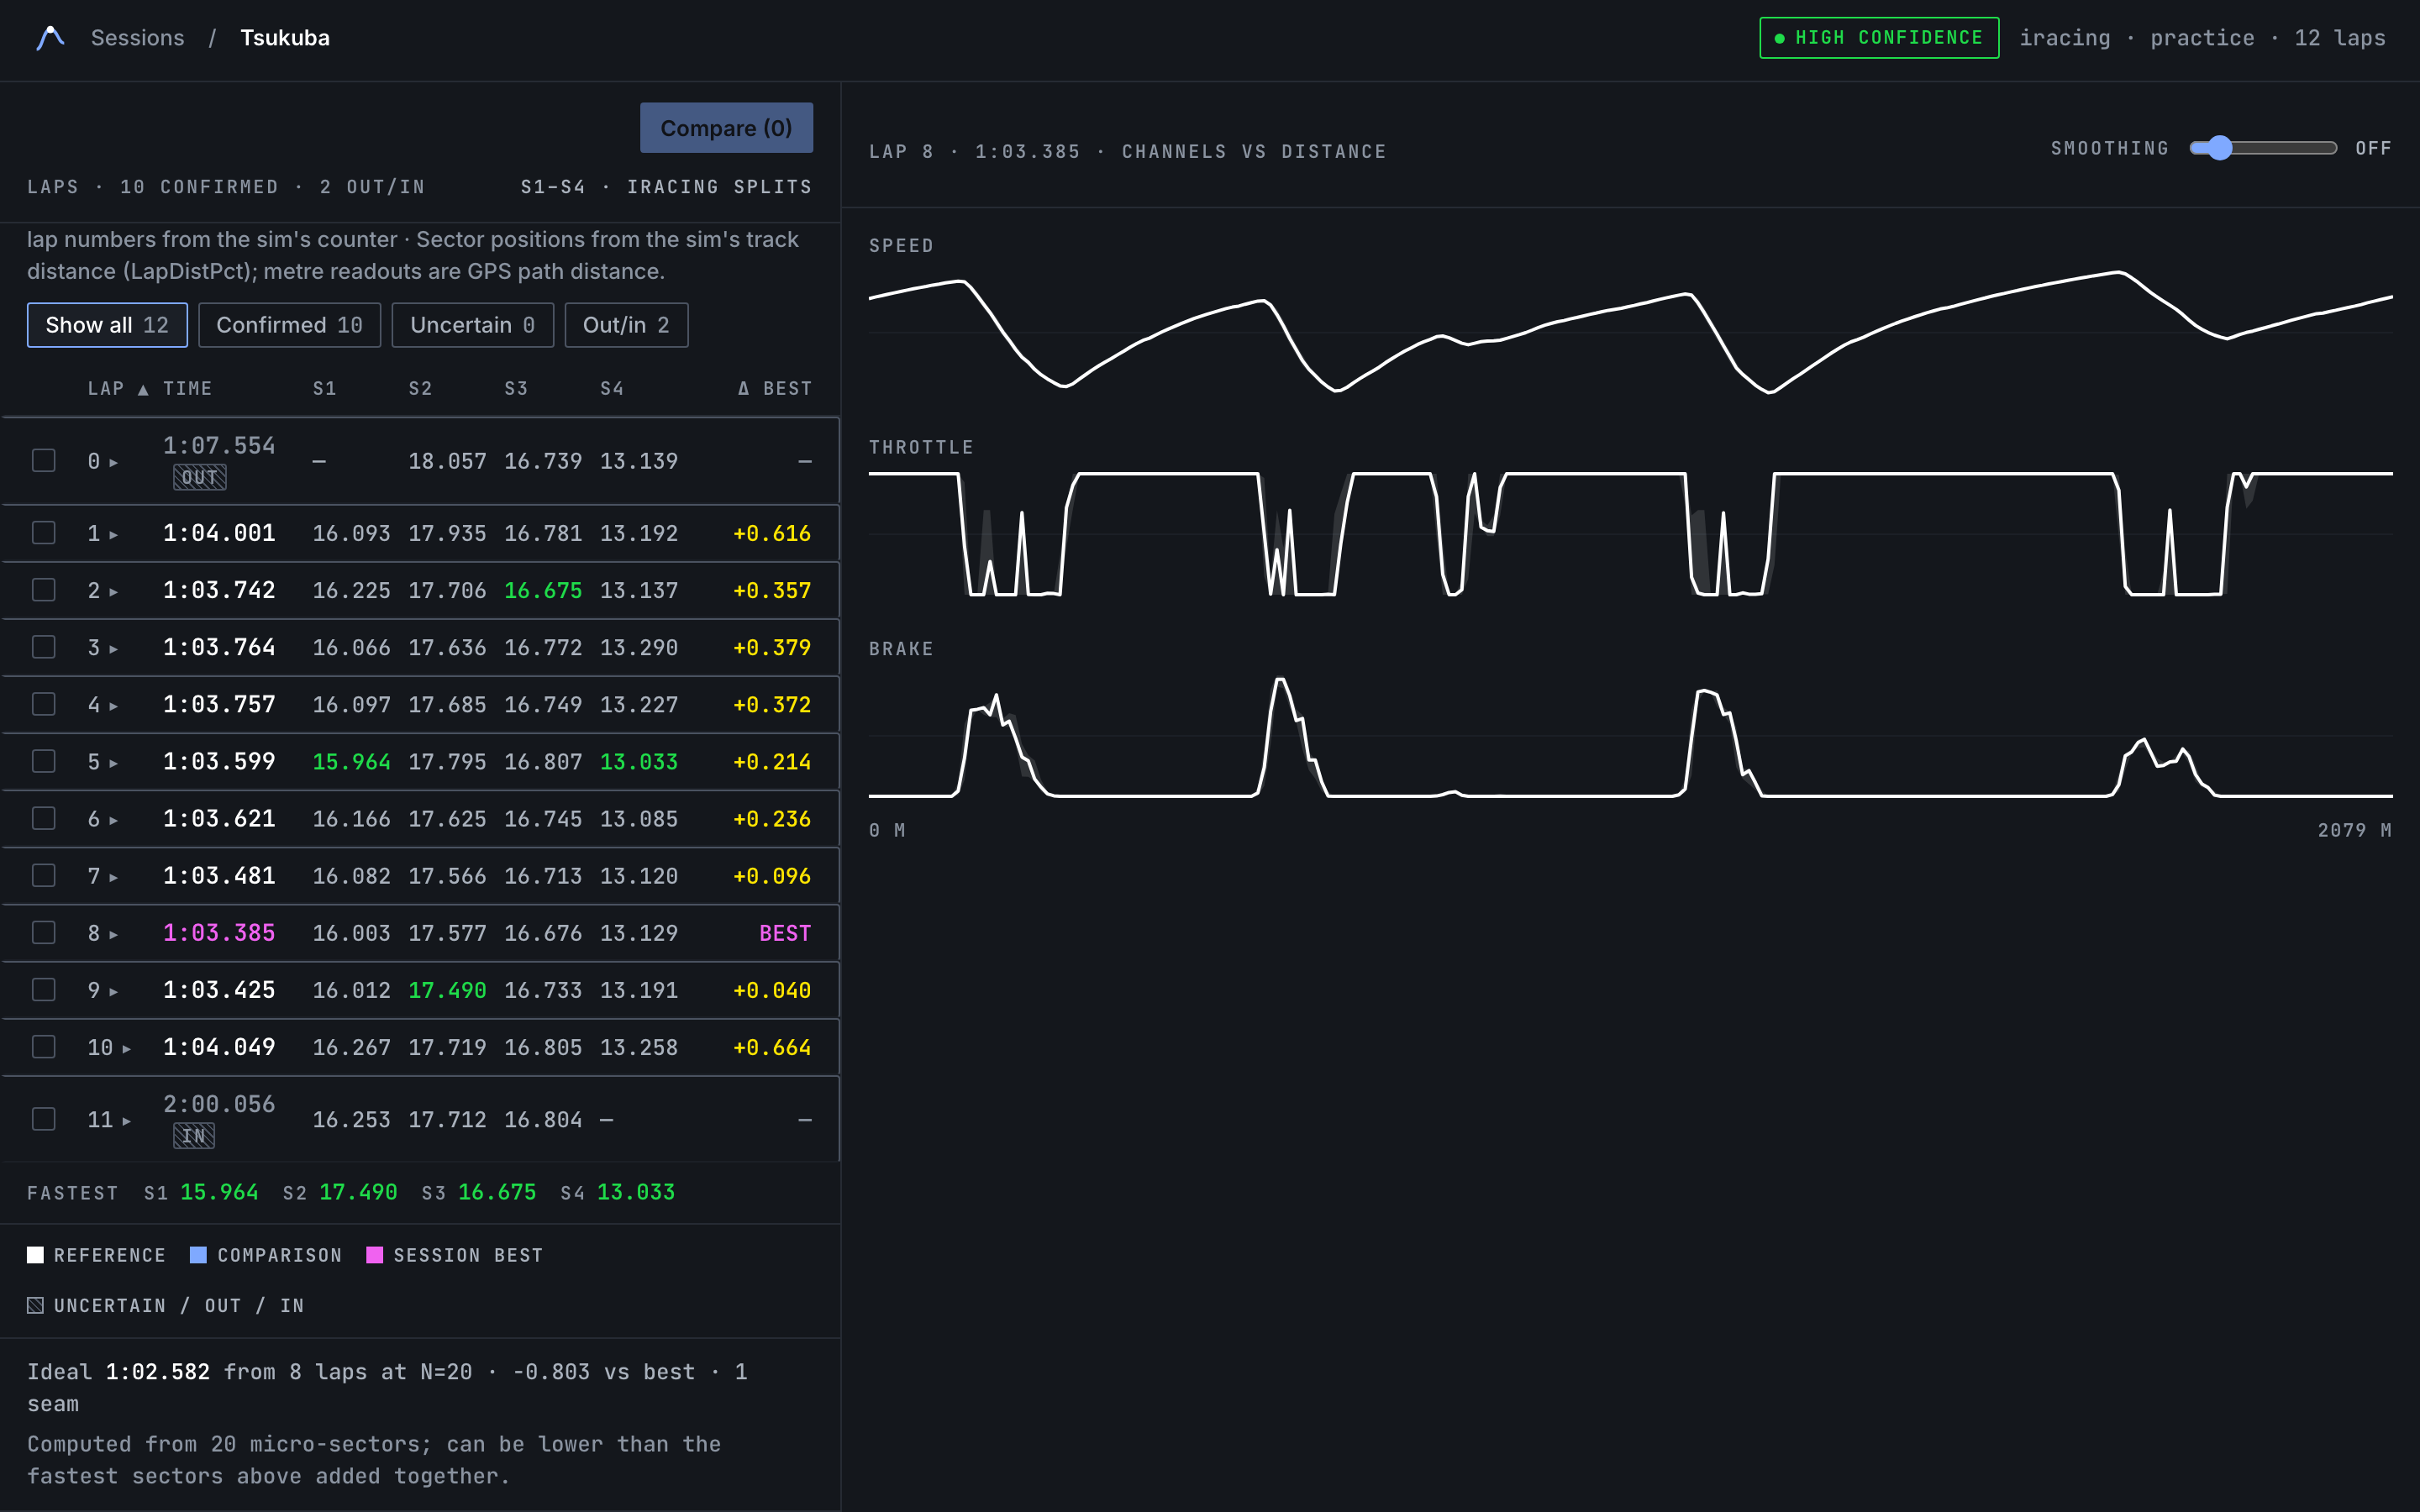
One row per lap: number, time, one column per display sector, and Δ best, the gap to the session's best lap. The best lap is marked BEST; the fastest time in each sector column is highlighted, and a Fastest row repeats them underneath. Click Lap or Time to sort.
- Tags
- OUT and IN are the partial passes at either end. UNCONF is a single unconfirmed segment. LOW is a lap marked invalid, or any lap in a low-confidence session; the reason is in the session's detection notes. See which laps are flagged and why.
- Filters
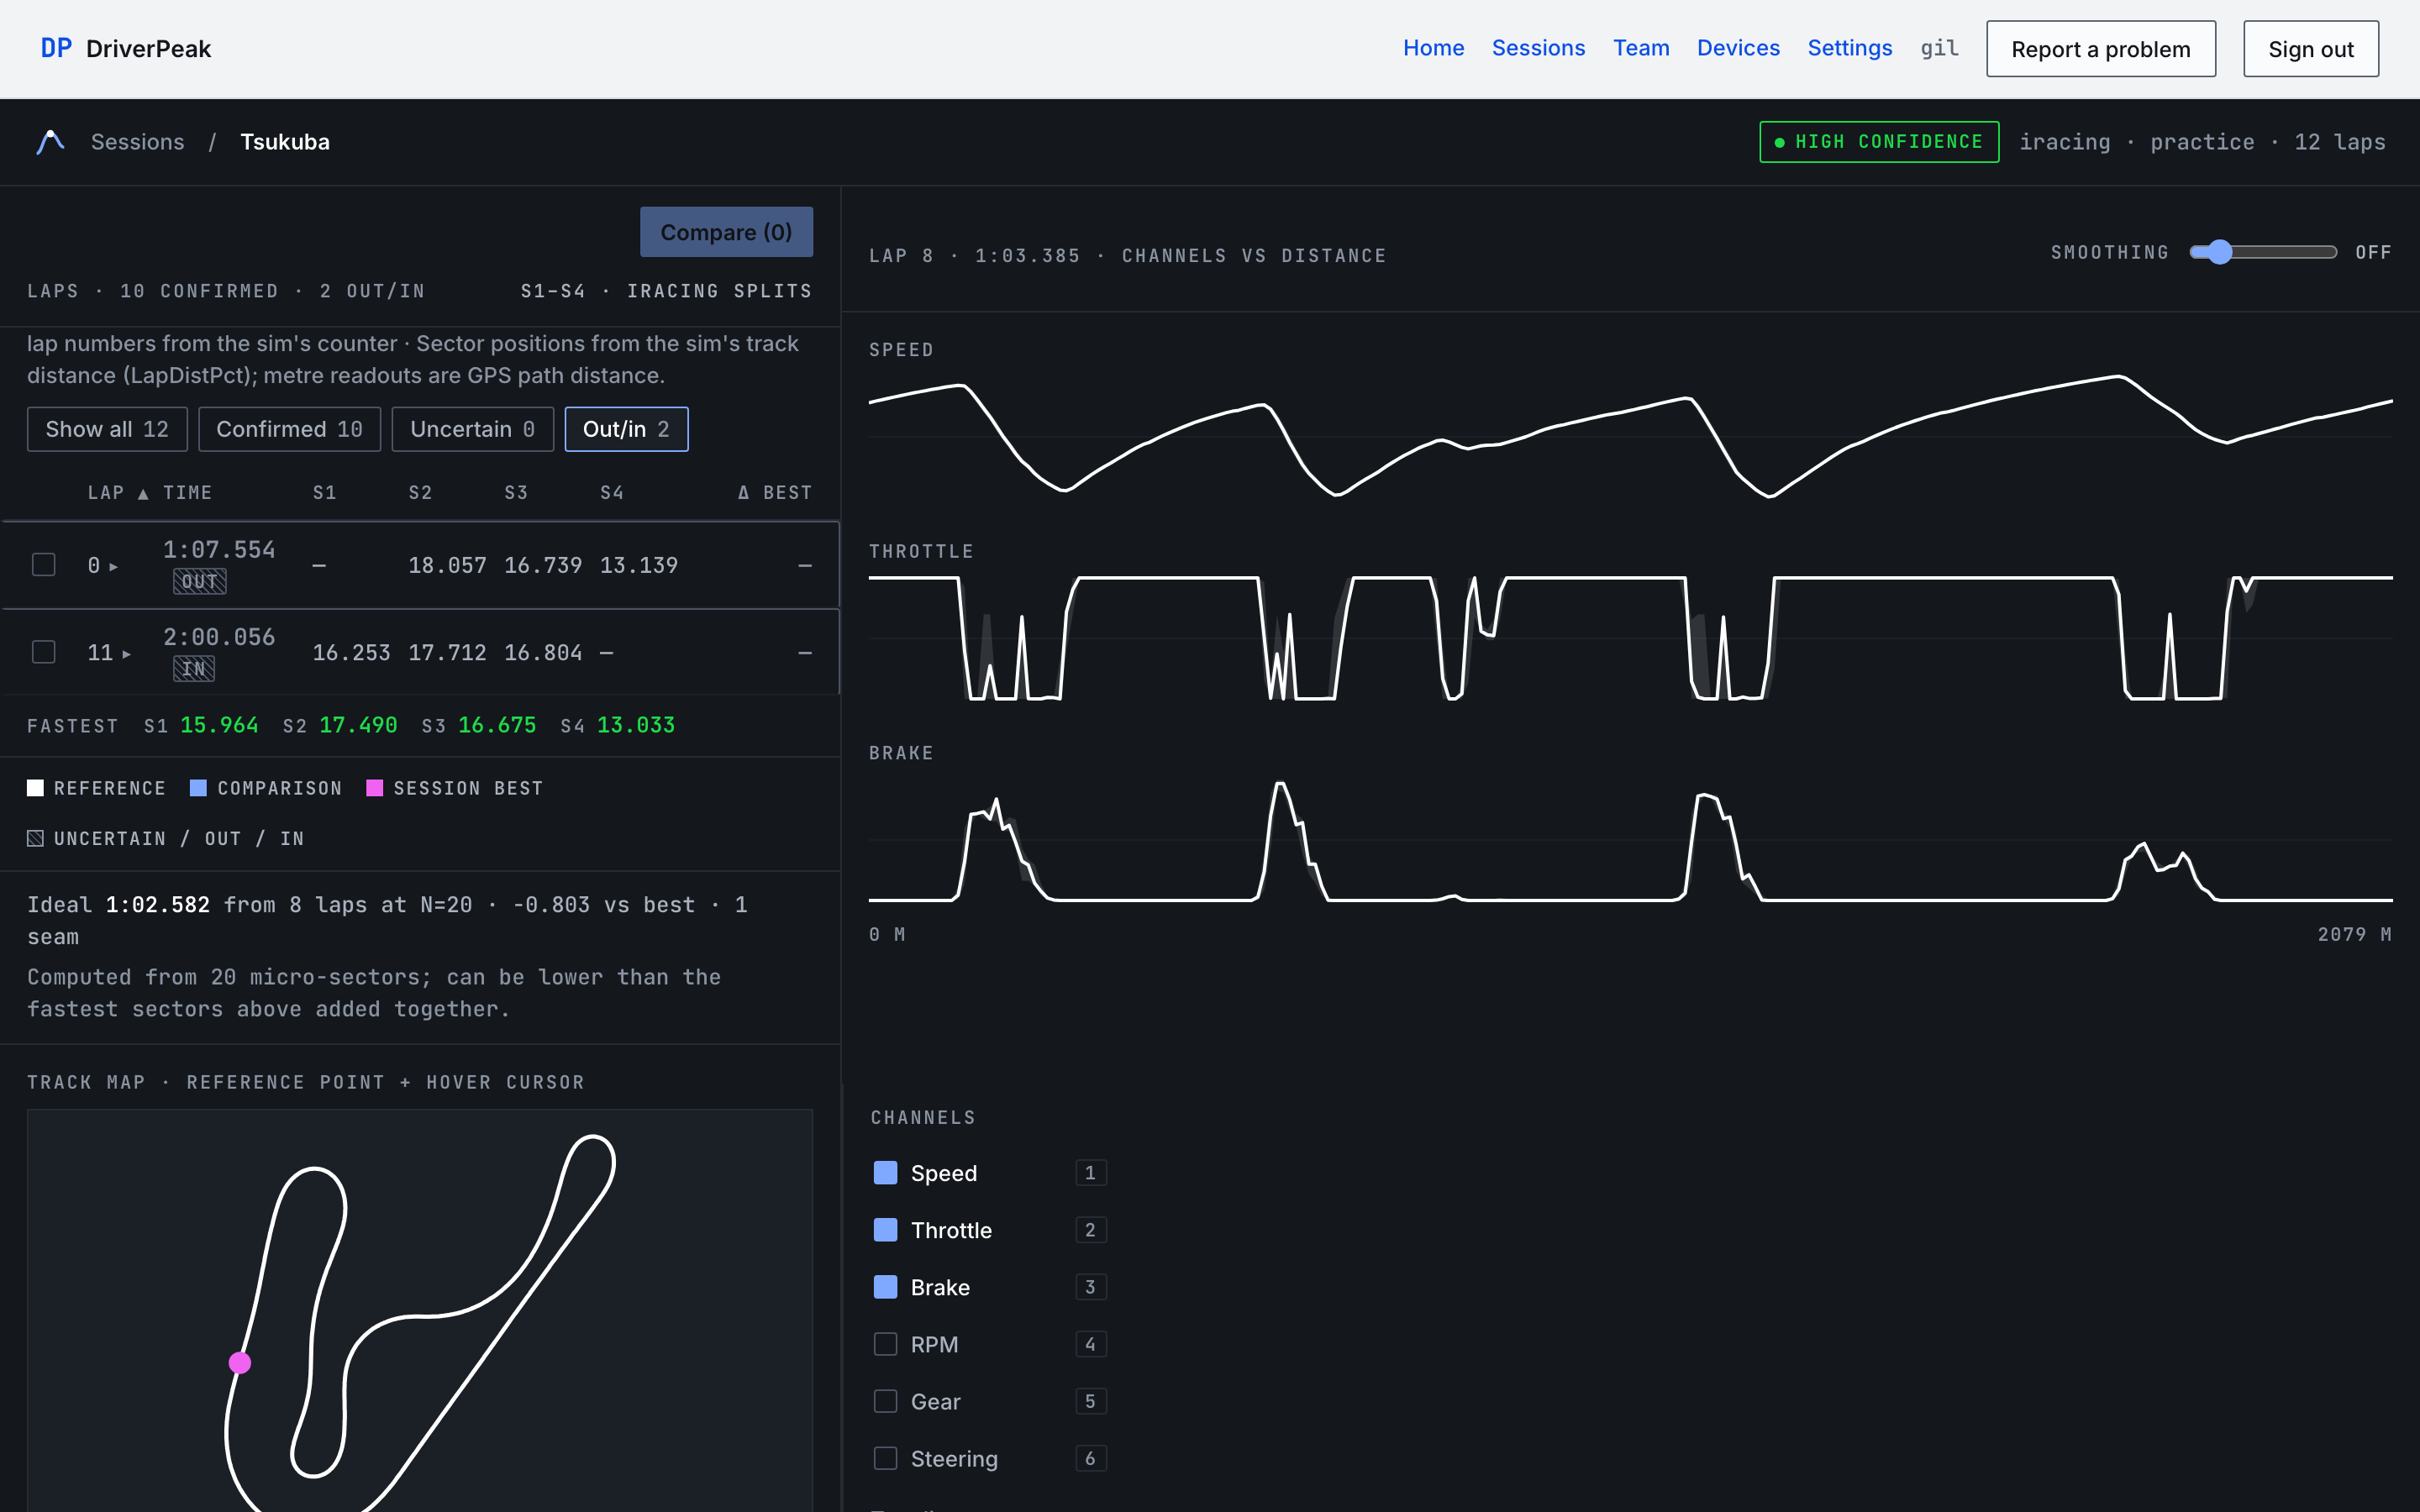
- Show all, Confirmed, Uncertain and Out/in, each with its count. A filter is a view: selection and sort are untouched, and a checked lap hidden by the filter stays checked, which the table says: 1 checked lap hidden by this filter — still selected.
- Selecting
- Click a row to check it. The first checked lap is the reference (white), the second the comparison (blue); a third and beyond are queued visibly and not charted. With nothing checked, the best lap is charted alone. Compare (2) opens the compare page with the two checked laps.
- Micro-sectors
- The ▸ beside a lap number opens the lap's micro-sectors: twenty equal fractions of the detected lap, the basis of the ideal lap. They are never the default view.
Where the sectors come from
The caption above the table says it: S1–S4 · iRacing splits (Tsukuba has four splits) or S1–S3 · equal thirds. For iRacing sessions the sector columns are the sim's own splits, and lap numbers come from the sim's counter; the note under the caption adds that sector positions come from the sim's track distance while metre readouts are GPS path distance. For every other logger there is no timing line in the file, so the sectors are three equal thirds of the detected lap, measured from the detected start rather than from a painted line. They are consistent within a session and not comparable to an official timing sheet.
Honesty note
A session uploaded before display sectors existed shows · not computed for this session in the caption and dashes in the columns until it is recomputed. The sector columns and the twenty micro-sectors are two separate divisions of the same lap-distance axis, each timed directly at its own boundaries: the sim's split positions or the thirds for the columns, equal twentieths for the micro-sectors. Neither is assembled by adding the other together.
The ideal lap
Under the table: Ideal ‹time› from ‹n› laps at N=20 · ‹gap› vs best. It is the best time of each of the twenty micro-sectors across the confirmed laps, added together. Because it is composed from micro-sectors rather than from the three display sectors, it can be lower than the fastest S1, S2 and S3 added together, and the line says so. A seam is counted where two adjoining micro-sectors come from different laps and the two laps' speeds at that boundary differ by more than 5 km/h, a transition no car made; the line shows the seam count so a composite with two seams can be told from one with fourteen. A low-confidence session adds approximate (low confidence).
Three reasons produce No ideal lap instead, each stated in full on the page: the session is No GPS or Single lap · unconfirmed, so there are no trustworthy sector boundaries (a low-confidence session still gets an ideal lap, marked approximate); no complete valid lap with sectors exists, because in-laps, out-laps, unconfirmed segments and invalid laps are excluded by design; or no eligible lap has a given sector, and a missing sector is never treated as zero.
Channels against distance
Every chart shares one axis, metres into the lap, so laps of different lengths line up by position rather than by time. Speed, throttle and brake are shown by default; RPM, gear and steering are in the rail on the right. A channel the logger does not record is listed as no data and cannot be switched on. Toggling a channel adds or removes its chart in place; scroll, zoom and the cursor are never reset.
- Cursor
- Hover any chart. The magenta cursor moves across every chart and the map at the same distance, and each chart's title shows the value at the cursor: the raw sample, never the smoothed one.
- Smoothing
- The slider above the charts, Off to 9pt, is a moving average that shapes the drawn line only. It is one value shared with the compare page for as long as the tab is open.
The track map
The map under the lap table is the circuit outline drawn from the charted lap's own GPS trace; no map tiles are loaded. The magenta dot is the detected start/finish reference point; a ring follows the cursor. A lap with no GPS shows No GPS trace for the selected lap. instead.
Keys and the smaller screen
- 1 – 6
- Toggle speed, throttle, brake, RPM, gear and steering, from anywhere on the page except inside a text field.
- Narrow windows
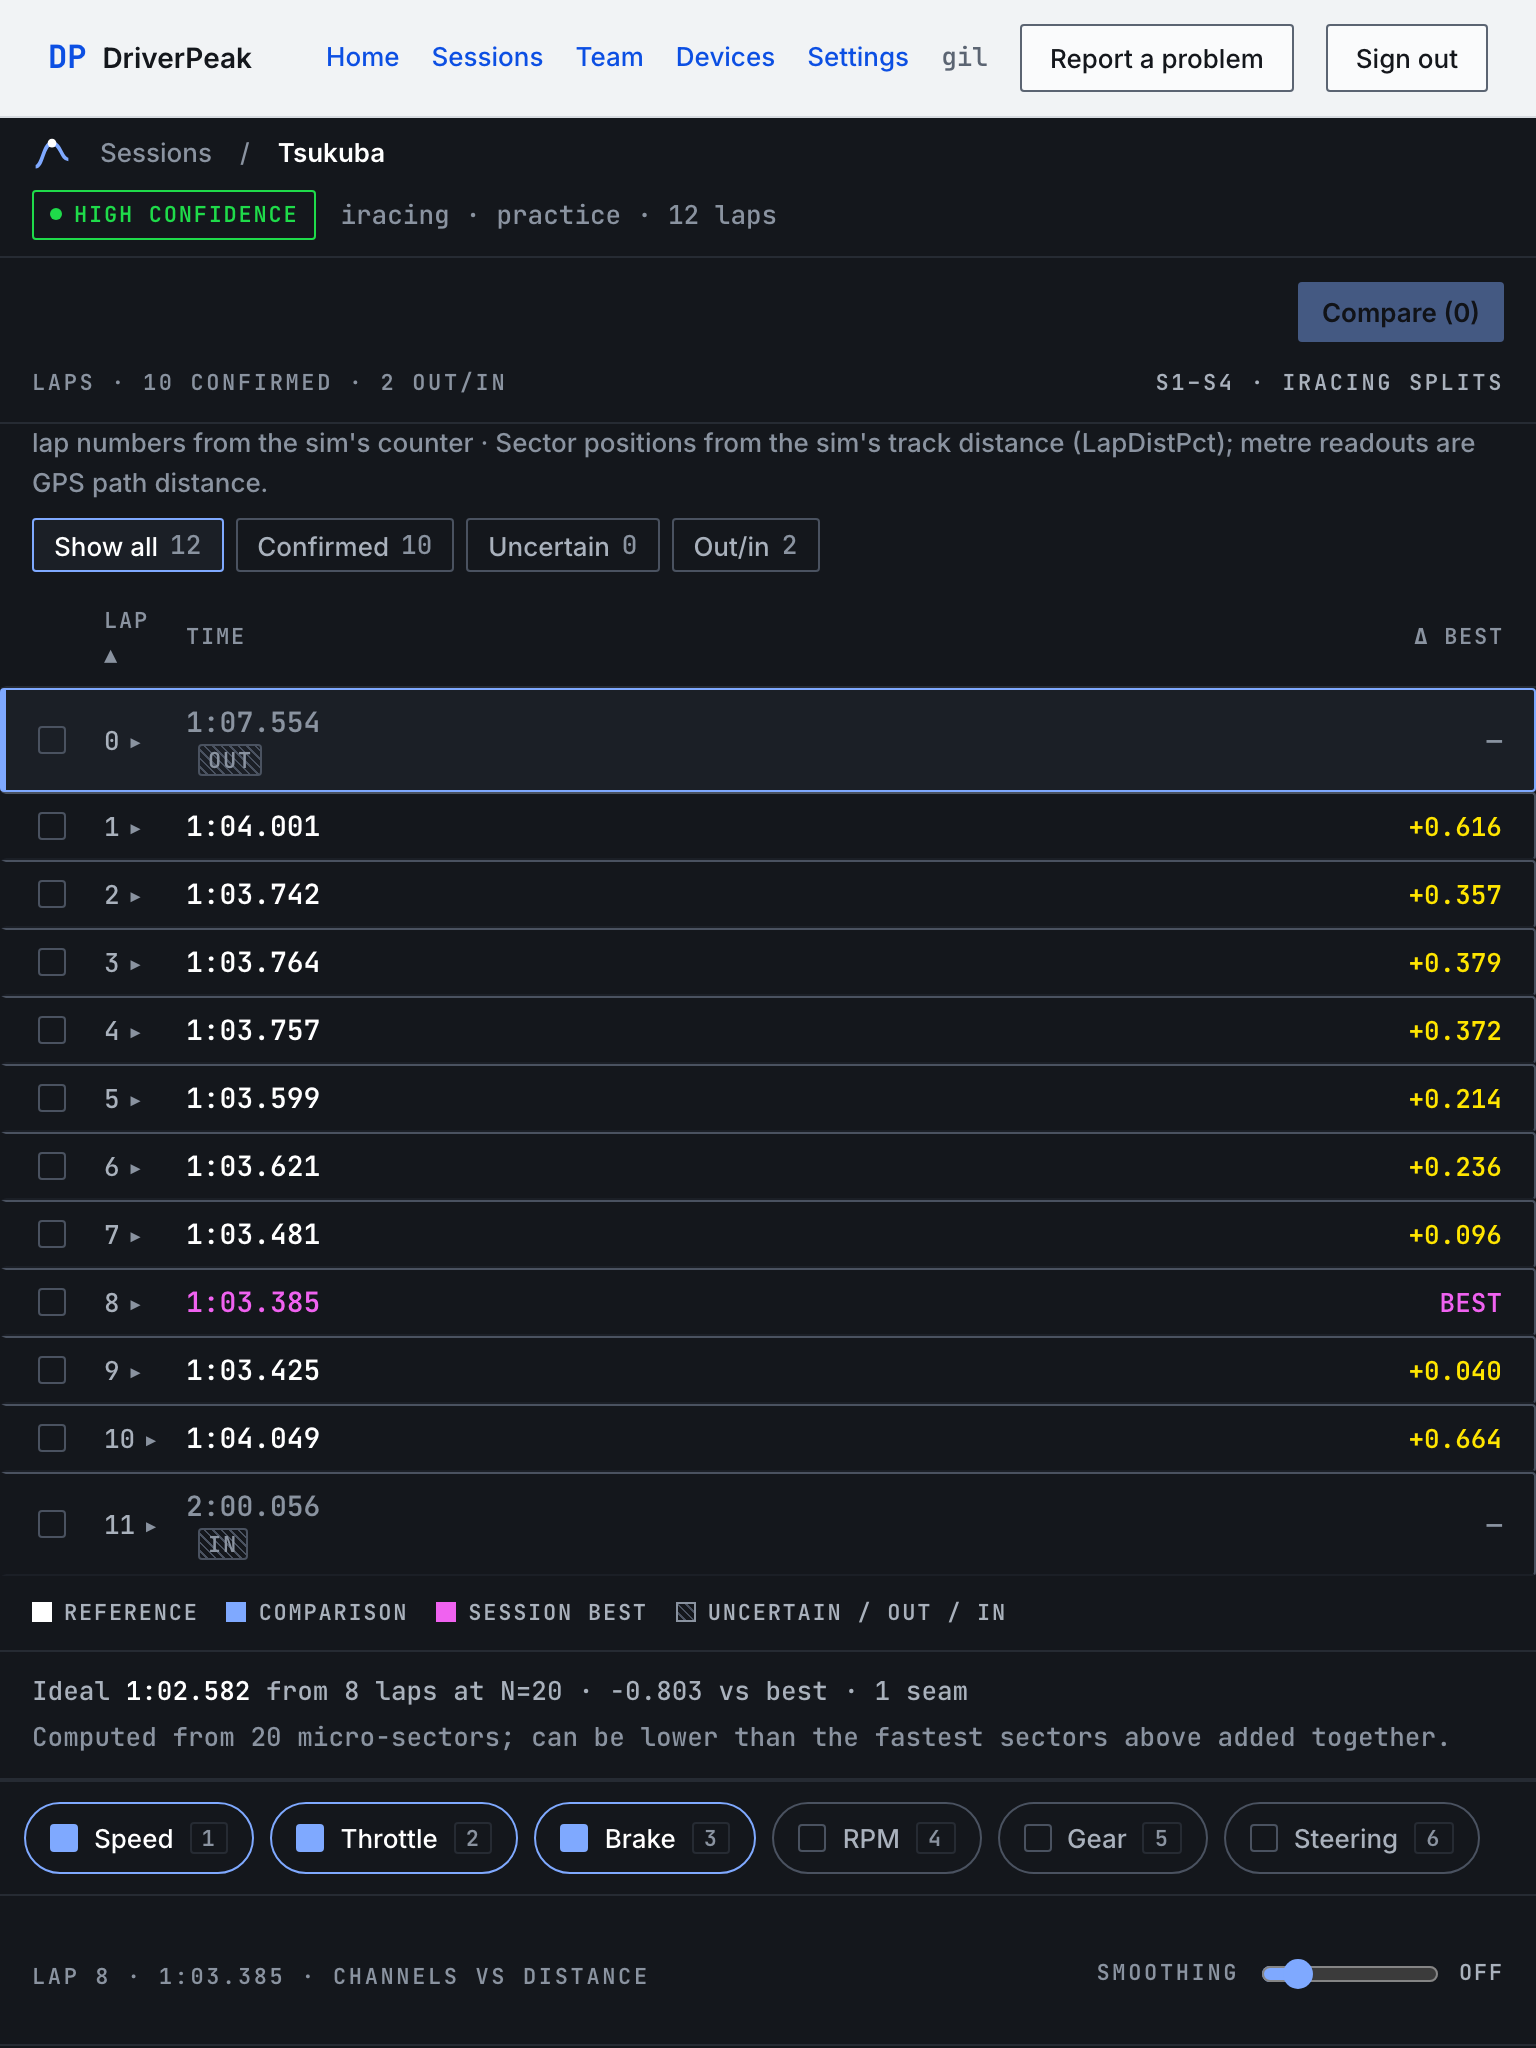
- Below about 1024 px the rail becomes a row of pills and the two columns stack: table, then charts. The tablet-width capture below shows the same session at 768 px.